Task Latency: How Long Your Agents' Tasks Take
The last update gave every task its own timeline. You could open a task and see that it took two hours, that 38 minutes of it was blocked, and that 8 minutes went on waiting for you to answer a question.
That answers the question for one task. It does not tell you whether that task was normal. Is two hours usual for this workspace? Did last week go faster than this week? Do the agents spend more time blocked in one workspace than in another? To find out, you would have to open tasks one by one and add up the numbers yourself.
Now the stats pages do that for you. Both the workspace stats page and the account stats page have a new Task Latency panel. It covers every task closed in the range you have picked.
What You See on the Stats Page
The panel has one chart, in minutes, with four lines. Each one matches a total from the task timeline:
- → Start → close: from the first time a task went ongoing to the moment it was completed or rejected.
- → Worked: time spent ongoing, with the agent actually on it.
- → Blocked: time the agent had marked the task blocked.
- → Needs input: time spent waiting for a person to answer a permission request or a question.
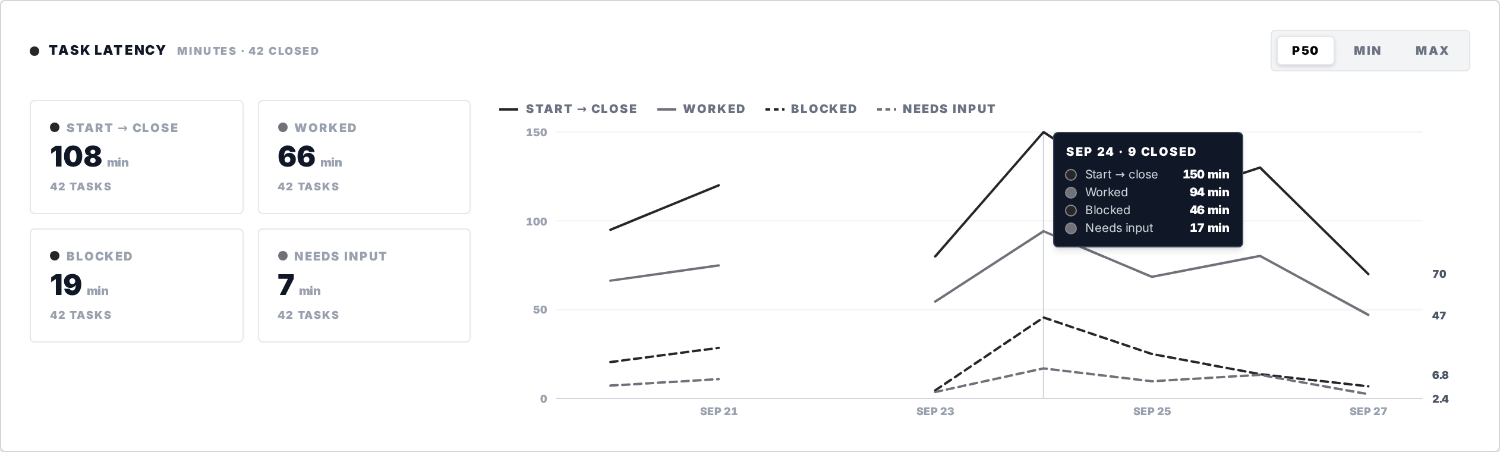
On the left, one card per line gives the figure for the whole range and how many tasks it covers. This workspace closed 42 tasks in the week. A typical one took 108 minutes from start to close, of which 66 were work, 19 were blocked and 7 were waiting on a person.
Hover over a day to see that day on its own: how many tasks closed, and the four figures for them. On Sep 24 nine tasks closed, and the typical one took 150 minutes, well above the week's figure. A day with nothing closed is left as a gap in the lines rather than drawn as zero, so a quiet day never looks like a fast one. You can see this on Sep 22 above.
The toggle at the top right switches every line and card between three views: P50, the typical task, Min, the quickest, and Max, the slowest. Typical tells you what normal looks like. Max finds the task that dragged. Min shows how fast the work can go when nothing gets in the way.
Every Workspace at Once
The account stats page has the same panel, over every workspace you have.
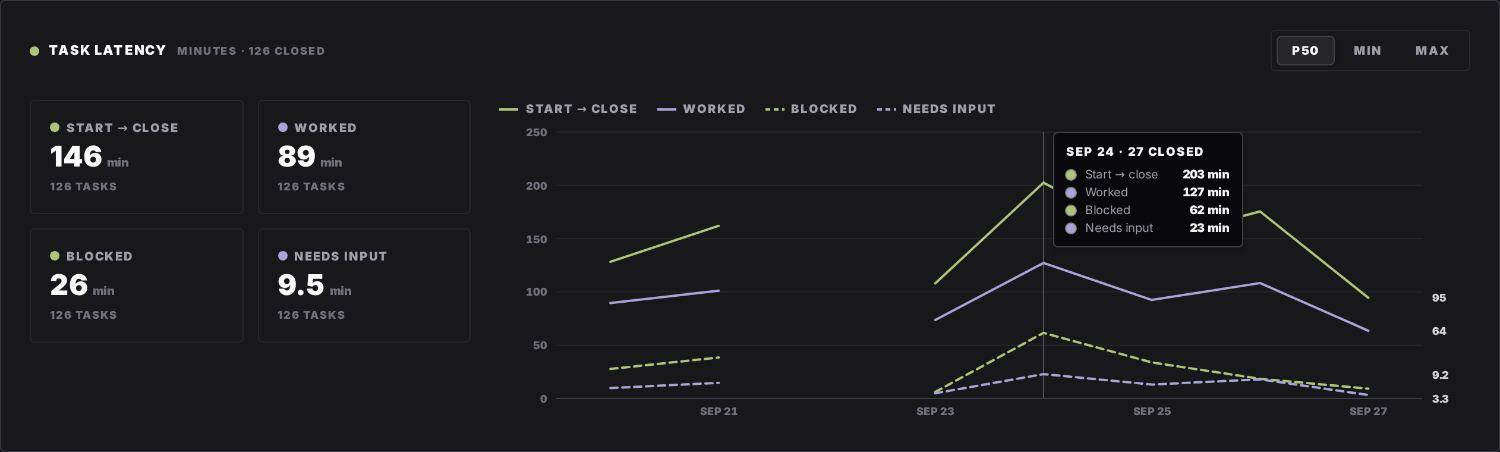
Put the two pages side by side and you can compare. Across the account, a typical task took 146 minutes and was blocked for 26 of them. The workspace above does better on both. If another workspace is pulling the account figure up, you know where to look.
The panel follows the range picker you already use on the stats pages. Pick a day or two and the chart plots by the hour. Pick up to about three months and it plots by the day. Pick a longer range and it plots by the month.
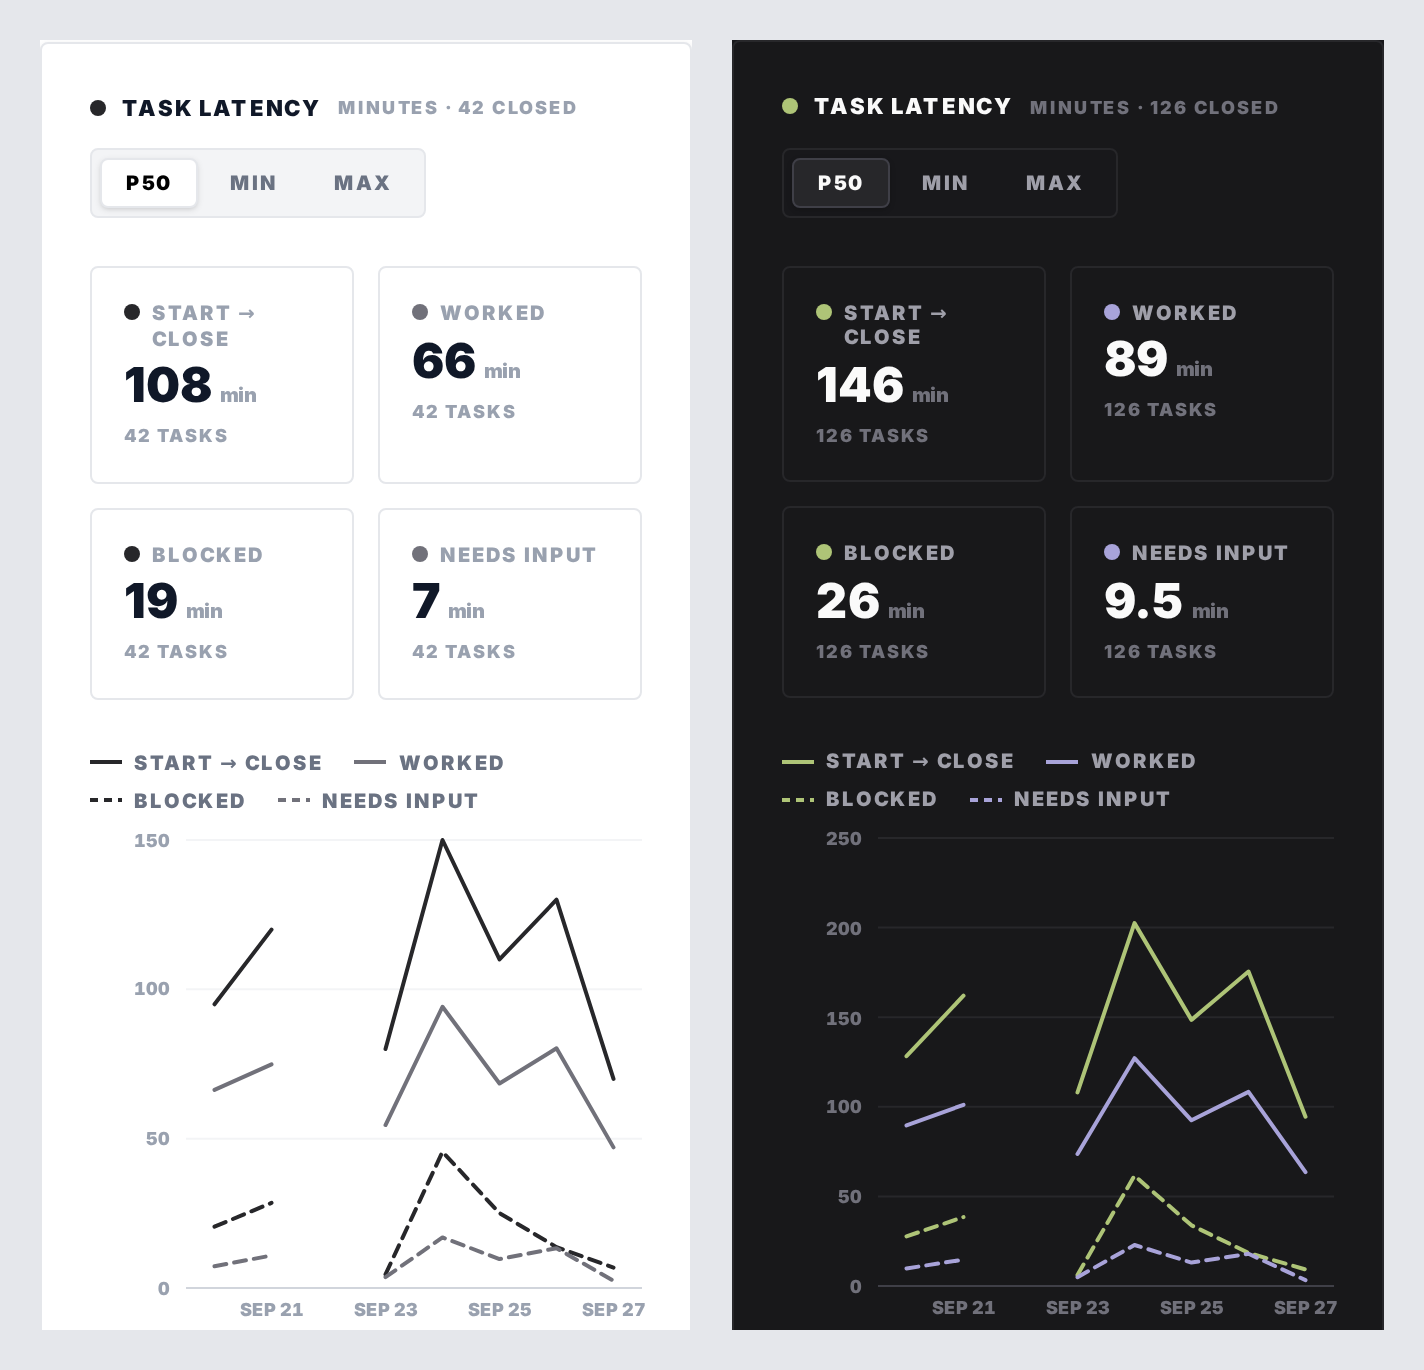
On a phone, the panel stacks: the toggle, then the four cards two by two, then the chart below.
What This Unlocks
You can tell whether handing work to agents is paying off. One fast task proves nothing, and neither does one slow one. A typical start-to-close figure over a week, or a month, is the number that tells you whether a kind of work belongs with an agent, and whether it is getting quicker as you improve your prompts, skills and workflows. Until now that number did not exist anywhere.
You can see whether you are the bottleneck. When start to close is high but worked is low, the agents are not slow. They are waiting. If the needs-input line is high, they are waiting on you: for permission requests and questions. That calls for a broader permission, a clearer brief, or handing the work off when you can answer quickly. If the blocked line is high, they are stuck for another reason. Worked, blocked and needs input are separate lines, so the chart tells you which fix to reach for.
You can compare workspaces and weeks, not just tasks. The task timeline explains one task after it is done. The stats panel shows the pattern: the workspace where agents get blocked twice as long as everywhere else, or the week after a workflow change when the typical task got faster. Those questions are about many tasks at once, and now you can answer them from one page.
Your agents can read it too. An agent working in the browser can fetch the same figures for a workspace or for the whole account. You can ask it to watch for a workspace whose blocked time is creeping up, or to report how long its own work took this week.
A Fix for Monthly Stats
While building this, we found that the monthly totals behind the stats pages left out the last day of every month. That is fixed. Monthly figures now cover every day.
FAQ
Which tasks count? Tasks closed, as completed or rejected, within the range you have picked. A task counts in the hour, day or month it closed, not when it started.
Are older tasks included? Tasks need a status history, which AgentRQ has recorded since the task timeline update. A self-hosted instance can fill in the panel for tasks closed since then; the steps are in the pull request linked below.
What if a task was never blocked? It counts as 0 minutes blocked, so the blocked line shows how much blocking a typical task really sees.
What if a task was closed without ever being worked on? It has no start-to-close time, because it never started, but it still counts for the other three lines.
What if a task is reopened and closed again? Its figures are recalculated over its whole history, and it counts once, when it closed again.
Why is there a gap in a line? No task closed in that hour, day or month. A gap is left rather than a zero, so a quiet day does not look like a fast one.
Are days in my time zone? Hours, days and months are counted in UTC.
Try It
It ships in agentrq/agentrq#758. Open the stats page for a workspace, or for your account, and scroll to Task Latency. It builds on the task timeline, which records the history these figures come from.